Launch TT&C Investigate Sample App | Design Materials and Source Code
The Investigate App displays system schematics and status data for a selected satellite. This allows operators to gather additional detail on alerts, view the relationships of components in the equipment hierarchy, and select particular values to add to the Watcher panel in the Monitor and Command Apps.
UX research revealed that existing systems often require operators to drill-in through the hierarchy of systems and subsystems in a manner that opens a new window each time. This forces operators to spend time and effort managing windows in order to find data they need. To overcome this problem, the design of the Investigate App allows operators to select an item of interest from a tree structure on the left side of the window and then drill-in to more detail using panes to the right, keeping everything in a single window.
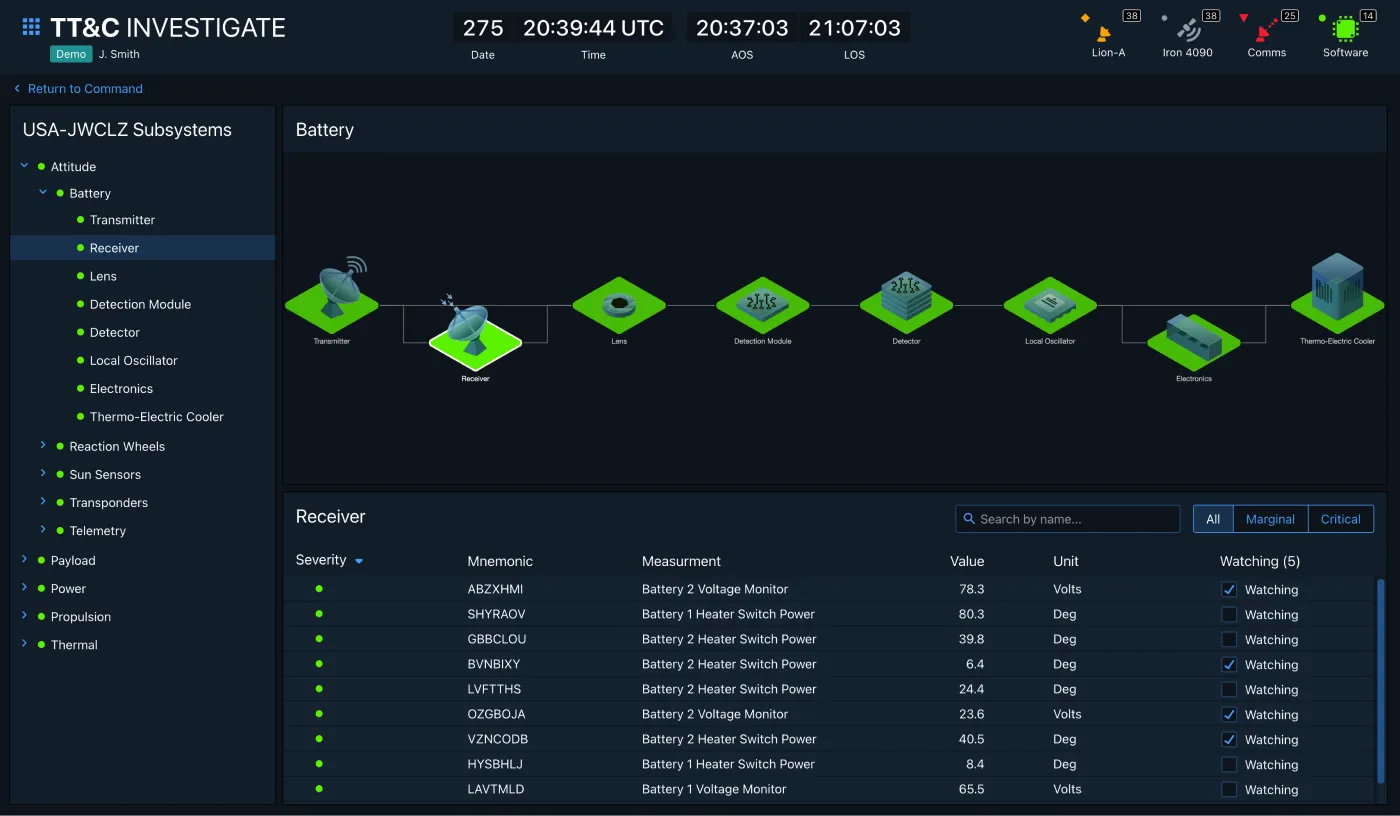
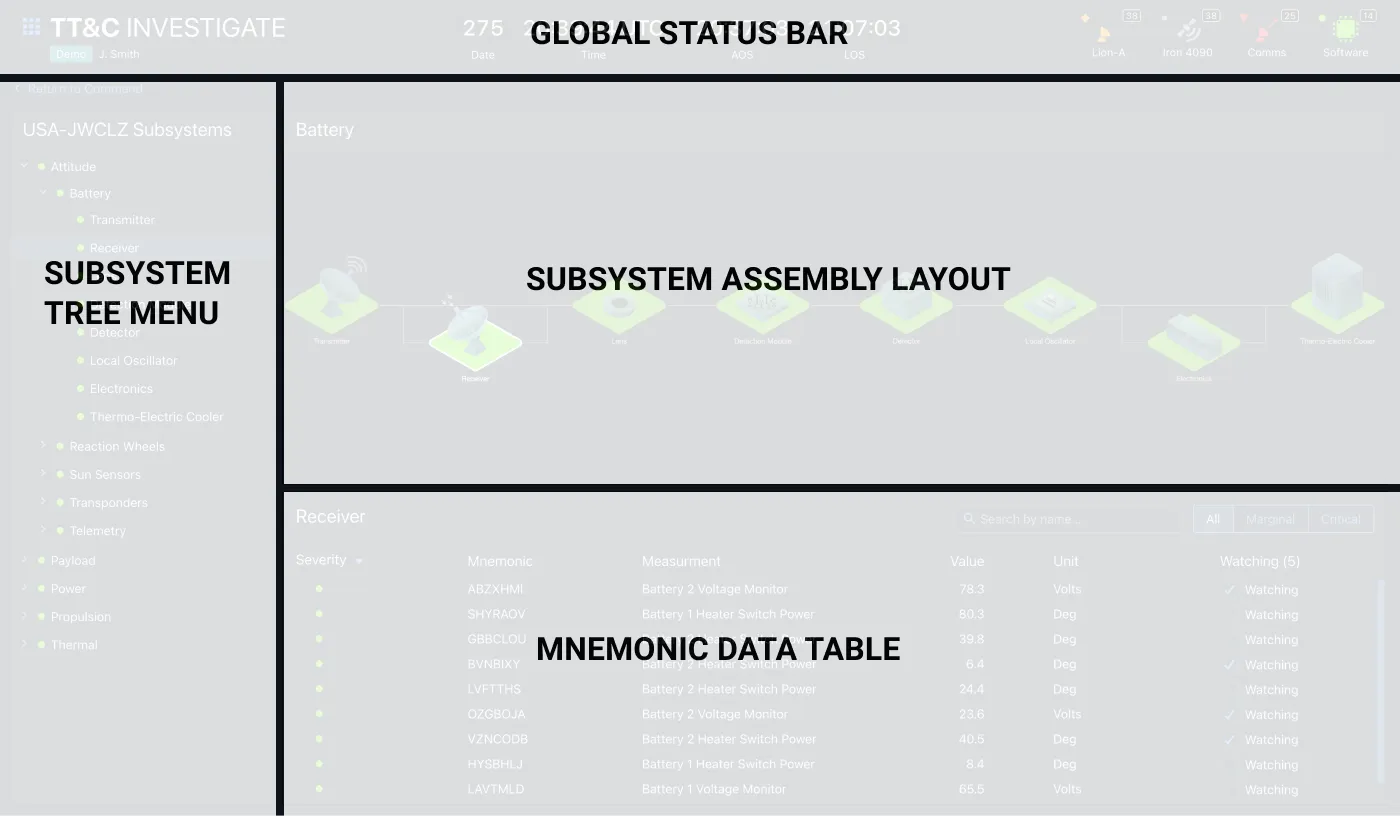
There are four main areas in the Investigate App: the Global Status Bar, Subsystem Tree Menu, Subsystem Assembly Layout, and Mnemonic Data Table. The key elements are described below, but you can find much more design and task flow detail in the TT&C Design Specification and Wireframes documents. You can also launch the TT&C Investigate Sample App to explore the design interactively.
Global Status Bar
As outlined on the About TT&C Designs page, each of the apps in the TT&C Suite is designed to occupy its own browser window, allowing operators to focus on the task at hand. But by virtue of being integrated into a suite, the apps share common functionality, such as a single login. Much of the shared functionality is provided in the Global Status Bar, an Astro component featured in all three apps. Though the status bar contents vary somewhat between apps in order to best support each app’s individual workflows, all contain a Clock, Monitoring Icons, and an App Switcher Menu that allows operators to transition quickly from one TT&C task flow to another.
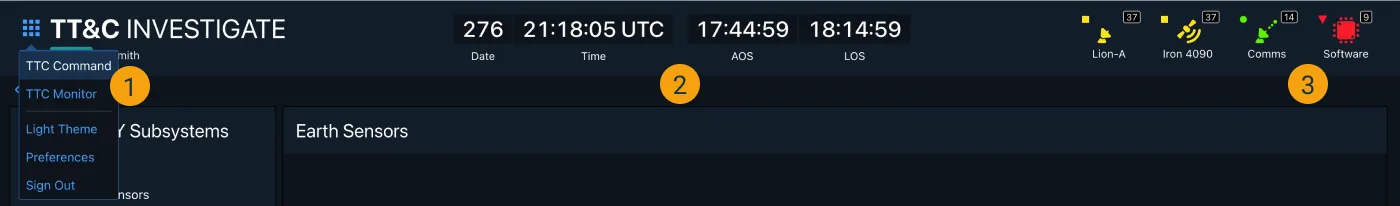
- App Switcher Menu - The App Switcher Menu allows the user to launch new instances of different TT&C apps, sign in/sign out, and edit preferences.
- Global Clock - Time is central to many TT&C service task flows, so it is included in the Global Status Bar in all TT&C apps.
- Monitoring Icons - The Investigate App includes software status indicators, as well as status and alert counts for each of the top categories in the equipment hierarchy.
Subsystem Tree Menu
The Subsystem Tree Menu shows a hierarchical list of the satellite subsystems. Status of lower level elements is bubbled up to the subsystem level so that operators can quickly identify subsystems that have problems without having to expand nodes in the tree. When a subsystem is selected, the related subsystem assembly layout and mnemonic data table is shown in the content area to the right.
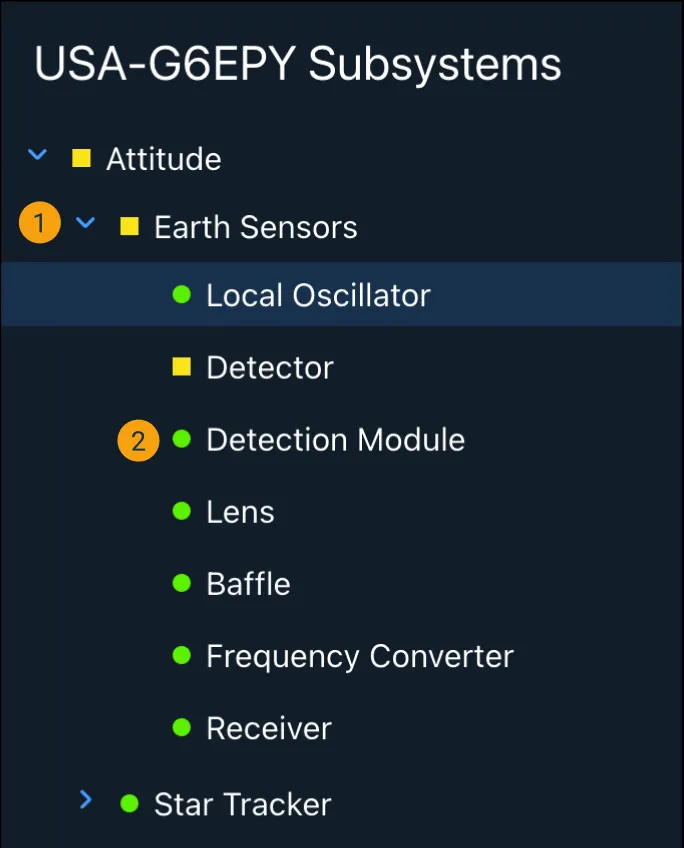
- Expandable List Items - Subsystem menu items expand to show any related sub-subsystems.
- Status Symbols - Status symbols indicate current subsystem status and severity.
Subsystem Assembly Layout
When an item has been selected in the Subsystem Tree Menu, its next level of detail is displayed in schematic form in the Subsystem Assembly Layout to the right. The elements in this schematic are color-coded to reflect the health status of the data mnemonics associated with it. Operators can then click on one of these schematic elements to load an additional level of detail in the Mnemonic Data Table that appears below.
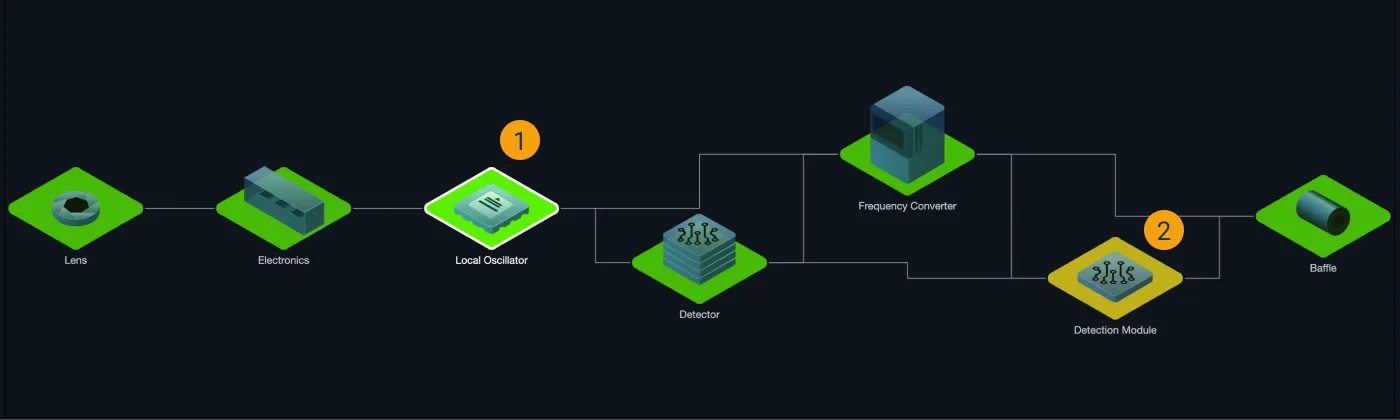
- Selectable Elements - Operators can select an element in the schematic to have its data load in the Mnemonic Data Table below
- Status Colors - The elements in the schematic are color coded to reflect current status.
Mnemonic Data Table
The Mnemonic Data Table displays the data for the component selected in the Subsystem Assembly Layout above. Because there could be a large number of mnemonics, the table includes the ability to do a type-ahead search for a particular item or filter the table by status. Once operators have identified a mnemonic of interest, the table includes the ability to add it to the Watcher panels in the Monitor and Command Apps to keep an eye on it over time.
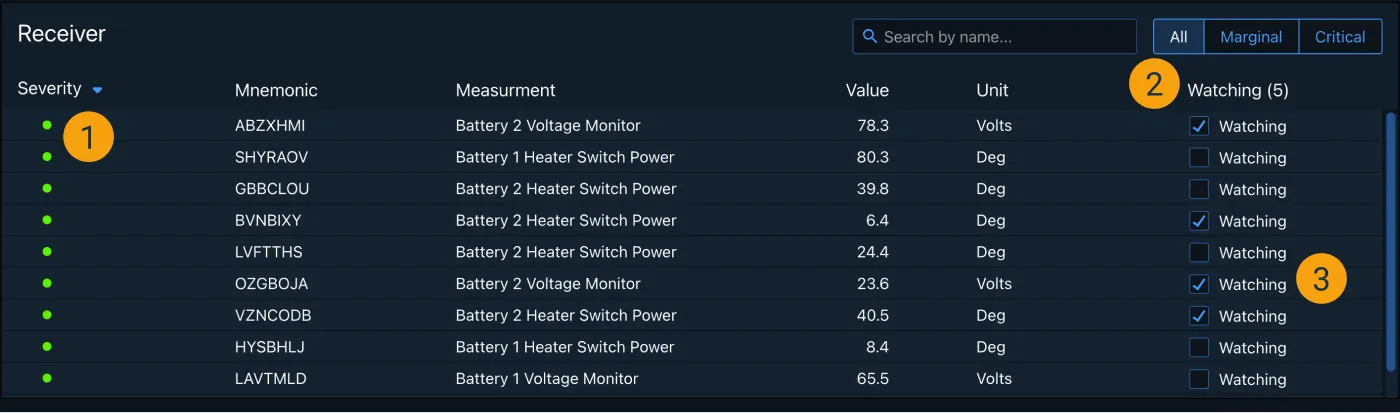
- Status Symbols - Symbols indicate current subsystem status and can be sorted by severity.
- Table Filters - The table can be filtered by name or severity to narrow down high volumes of content and surface the most relevant results.
- Add to Watcher - Clicking the checkbox adds the row item, or mnemonic, to the Watcher component in the Monitor Application.
Task Flow Example - Add Mnemonics to Watcher
Below is an animated walkthrough of a representative task flow using the TT&C Investigate App. In this flow, an operator uses the app to identify a problem in a satellite subsystem assembly and then adds two mnemonics to the Watcher panels in the Monitor and Command Apps.

Design Materials and Source Code
Below are design and development resources to get you started on an app that supports TT&C services. Note that there are some discrepancies between the design documents and the TT&C Investigate Sample App due to design improvements that were introduced late in the app development cycle.
| Resources | Description |
|---|---|
| TT&C Design Specifications (pdf) | The TT&C Design Specification contains information on use cases, task flows, UX research and wireframes for key features of the TT&C App Suite. |
| TT&C Design Wireframes (pdf) | The TT&C Design Wireframes document contains the complete set of wireframes (mid-fidelity renderings) of the screens designed for the TT&C App Suite. |
| The source code Git repository and other useful documentation for the TT&C Investigate App is hosted at github.com so that you can check it out in detail. |